
Introduction: When Tags Go Quiet at the Worst Time
When a cluster of historian tags stops updating or goes stale around shift change, the first instinct is almost always to call the network team. That call usually costs hours and rarely finds the fault. Before you make it, look at when the gap started and who was logging on or off at the time. The timing points to the layer where the problem sits.
Plain-Language Definitions
Saying “the tags dropped” means different things to an operator, a SCADA engineer, and an IT admin, so it is worth fixing the vocabulary before running any checks.
- SCADA historian – the time-series database that stores values from sensors, PLCs, and RTUs over time, giving you trends, reports, and audit history.
- Tag loss – one or more tags stop being collected or written to the historian, so the data simply is not there.
- Stale tag – a tag that holds its last known value but has not refreshed within its expected update interval.
- Bad-quality tag – a tag that is still receiving some signal but carries a quality flag marking it doubtful, bad, or a communications failure.
- Shift change – the operational handover when one crew logs out and another logs in, notes are exchanged, and settings or modes may change.
Why the Timing Matters Most
Shift changes happen on a schedule, and so does most of what breaks at them. A failing switch or a damaged cable does not care what time the crew changes over. When the same gap appears at the same hour every day, look at scheduled human and software activity before you look at hardware. That is why SCADA historian tag loss at shift change works as a diagnostic label rather than a complaint.
The Four Checks You Will Apply
Run these four checks before opening a network ticket:
- Check 1: Operator and session activity during the handover window.
- Check 2: Historian service, buffer, and archive health.
- Check 3: Interface and collector configuration for the affected tags.
- Check 4: Scheduled jobs, clock alignment, and timestamp handling.
If all four come back clean, the evidence supports a network ticket. If one fails, the finding names the layer to fix and gives you something specific to write in the ticket.
Why Tag Loss Clusters Around Shift Change
Historian tag loss does not spread evenly across a day. It bunches up at the shift boundary, where several independent events land in the same short window and overload part of the data path.
The Logon and Logoff Storm
When one crew hands over to the next, a burst of client activity hits the network at once. Operators log on to their workstations, open the same trend displays, and start pulling the same high-density data streams. For a few minutes the number of active clients can double, and all of them compete for the same collector and historian resources. The sessions that lose that competition are often the ones that quietly stop recording.
Session Termination and Logoff Scripts
Many sites bind logoff scripts to HMI sessions. The scripts close applications, clear caches, and drop network shares. If one of those clients was relaying or buffering readings, the teardown can end the flow before the last values reach the historian. The gap is real, but the cause is a script doing exactly what it was written to do, not a broken wire.
Load Spikes and OPC Re-subscription
Every new client that opens a display triggers a fresh OPC tag subscription, asking the server to start reporting a set of items. At a shift boundary dozens of these can fire within seconds. The server has to publish item handles, confirm them, and begin streaming values, and a saturated server may drop or delay the confirmations. Failed subscriptions are a classic source of missing tags, while partial ones often surface as bad-quality tags even though the connection itself is fine.
Collector Buffering and Queueing
Collectors buffer short interruptions, but the buffers are finite and queues drain at a fixed rate. When the inbound flow spikes while the server is busy authenticating new clients, the queue grows faster than it empties. If the buffer wraps, the oldest samples are overwritten and genuinely lost. In lighter cases nothing is lost: the samples arrive later than expected, which still looks like a gap on a tightly zoomed trend.
Scheduled Overlaps: Backups, Reports, Maintenance
Shift boundaries are a convenient time to run heavy jobs because few people are watching. Backups, report generation, and database maintenance frequently start on the same hour the crews change, and they compete for disk I/O, CPU, and database locks with the burst of new subscriptions and buffered writes.
Lost vs. Delayed vs. Degraded: Telling Them Apart
The three outcomes need different responses. Data actually lost means samples were never written and cannot be recovered, usually from a wrapped buffer or a dropped subscription. Data delayed means the samples exist but landed late, so a trend shows a gap that later fills in. Degraded quality means the value is present but a bad-quality flag marks it untrusted, often after a timeout or a failed handshake. Work out which of the three you are looking at before you blame the network.
Most Common Shift-Boundary Triggers
- Multiple operators logging on and opening trend displays simultaneously
- Logoff scripts shutting down client applications and data paths
- Batched OPC tag subscription requests overwhelming the server
- Collector buffers and queues wrapping under burst load
- Backup, report, and database maintenance jobs scheduled on the hour
- Server authentication and session startup competing with data flow
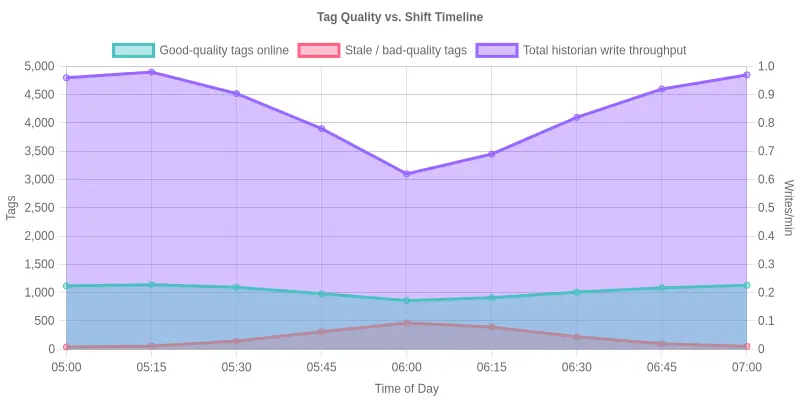
The chart shows stale and bad-quality tags climbing through the minutes before handover and peaking at the 06:00 boundary (465 tags), while good-quality tags fall to a low of 860 and historian writes drop to 3,100/min. Everything recovers within roughly 45 minutes. A genuine network fault tends to stay broken rather than heal once the changeover is complete.
Check 1: Client Sessions, Logons, and Logoff Scripts
At shift change the plant-floor computers change hands. Windows sessions end, logoff scripts fire, and client software comes and goes. If your SCADA historian depends on a client session staying open to keep collecting, every shift change becomes a small window of risk. This is the first place to look.
What Actually Happens at Logoff
An HMI or historian client is not the historian server. Closing a client should never stop the server from recording data, but it often does, because collection is driven by a script, an .exe that starts with the login, or a workstation that is the only place a data-collection service was installed.
When the outgoing operator logs off, three things can happen: the logoff script terminates a background collection process, a redundant server pair fails to hand over cleanly, or the historian keeps buffering data with nowhere to write it. Any of these produces what looks like tag loss at shift change, a gap that lines up with the moment one person left and another arrived.
Why Delayed Data Looks Like Lost Data
Many historian clients cache or buffer readings when the connection drops. The data is not gone; it sits in a local queue waiting to be forwarded. On a trend graph that queue looks identical to a hole. Operators see a flat line or a missing segment and assume the tags died, when the values may appear minutes later once the buffer flushes. Check the buffer depth and forward time before declaring data lost.
Verification Steps
- Log on as the day-shift operator and confirm the historian is actively recording a known tag.
- Open the timestamped event or message log and note the exact time it records data.
- Log off cleanly using the normal operator method, not a forced shutdown.
- Immediately check whether the data-collection application, service, or script stopped, and whether the log shows a clean stop or an unhandled kill.
- Confirm the historian server is still collecting and that a redundant server has taken over if the primary dropped.
- Wait five minutes with no client open, then verify new rows are still being written.
- Log back on and confirm the session reconnects and flushes any buffered values.
What a Pass Looks Like
The historian server keeps writing while no client is open. Logoff scripts close only the user interface, not the collection engine. Redundant servers fail over cleanly, and buffered data flushes within a predictable time and appears in trends with its original timestamps. The shift-change gap never appears in the first place.
What a Fail Looks Like
Data stops the moment the operator logs off and resumes only when the next operator logs on. The collection process shows a stop event tied to the logoff script, the standby server never took over, or the buffer grew and was discarded. A clean, repeatable gap at every shift change is a strong sign the problem is session handling, not the network.
Check 2: Server Side: Historian Service, Connectors, and Database Connectivity
Confirm the server side of the data path is healthy before touching the network: the historian service state, the connector layer, and the database write path.
On each node, check the historian service. A service that has restarted, paused collection, or exhausted its internal queue will drop incoming values even when the network is fine, so confirm the process is running, that its uptime predates the shift boundary, and that buffer depth is returning to normal rather than climbing.
Then check every SCADA historian connector and collector. A connector that reports “connected” can still be failing individual reads, so verify per-tag status and interface error counts rather than trusting the top-level connection flag.
Review the database connection pool next. Pool exhaustion or a low max-connection limit makes new writes wait, time out, and disappear. The pool settings should match the collector’s write concurrency; a mismatch produces intermittent loss that resembles a network fault.
Check transaction retry behaviour as well. If retries are capped low or disabled, a single failed batch is dropped permanently. Values lost in that window form a batch that never backfills, because the collector advances its cursor past the gap and treats older samples as already processed. That pattern is a common cause of historian tag loss at shift change.
Finally, look for scheduled maintenance such as backups, index rebuilds, log rotation, or collector restarts that coincides with the shift boundary.
Signals to Look For in Logs
- Historian service start, stop, or “collection paused” entries near the shift time
- SCADA historian connector connect, disconnect, and read-timeout messages
- Connection pool wait or “pool exhausted” warnings
- Transaction rollback or “max retries exceeded” errors
- Database backup, maintenance, or lock-wait entries
- Gaps between the last good sample and the shift-change timestamp
To tie the interruption to shift change, line up three sources: connector logs, database error logs, and event or shift records. Note the last successful write and the first missing tag, then compare that interval with the shift-change timestamp. If the window opens within seconds of handover, the maintenance or retry gap is the cause, not the network.
The table below compares how the four checks behave at the shift-change boundary.
| Check number and name | Primary layer or component | Typical symptom at shift change | Where to look first | Fastest verification step | Network fault likely the cause? |
|---|---|---|---|---|---|
| Check 1 – Historian Collector Service Health | Application / service layer on the historian node | All tags on one collector flip to “bad quality” or freeze the moment operators log in | Windows Event Viewer plus the collector’s own service log | Restart the collector service and watch whether tags resume within 30 seconds | Unlikely – impact stays local to a single node or service |
| Check 2 – OPC Interface and Licensing | Interface / DCOM communication layer | One PLC or RTU goes stale while every other device keeps updating normally | Interface status screen, license file, and DCOM configuration | Ping the device, then run a single test OPC read to confirm the value returns | Sometimes – DCOM and path issues mimic it, but expired licenses fail the same way |
| Check 3 – Time Synchronization and Clock Drift | Host / time layer driven by NTP | Timestamps arrive out of order and gaps appear exactly at the shift boundary | NTP configuration, the w32tm status output, and the historian time log | Run w32tm /stripchart or compare node time against the time source | Possible – NTP rides the network, yet a wrong source or config causes most cases |
| Check 4 – Shift-Change Batch or Config Reload | Configuration / scheduler layer | All or many tags stop the instant a shift-change script or production batch fires | Task Scheduler, the shift script, and the scheduler configuration | Disable the shift-change task and watch whether the tags come back | Unlikely – automation and config reloads, not cabling, sit behind this one |
Three of the four checks usually point away from the network, so confirm the collector service, the interface connection, and the clock before you pull a switch and start chasing cables.
Where the Data Actually Goes: Mapping the Path and Checkpoints
The schematic below traces the route a tag takes from the field device, up through the control layer, into the collector, and on to the SCADA historian and client workstation, with the four checks marked along the way.
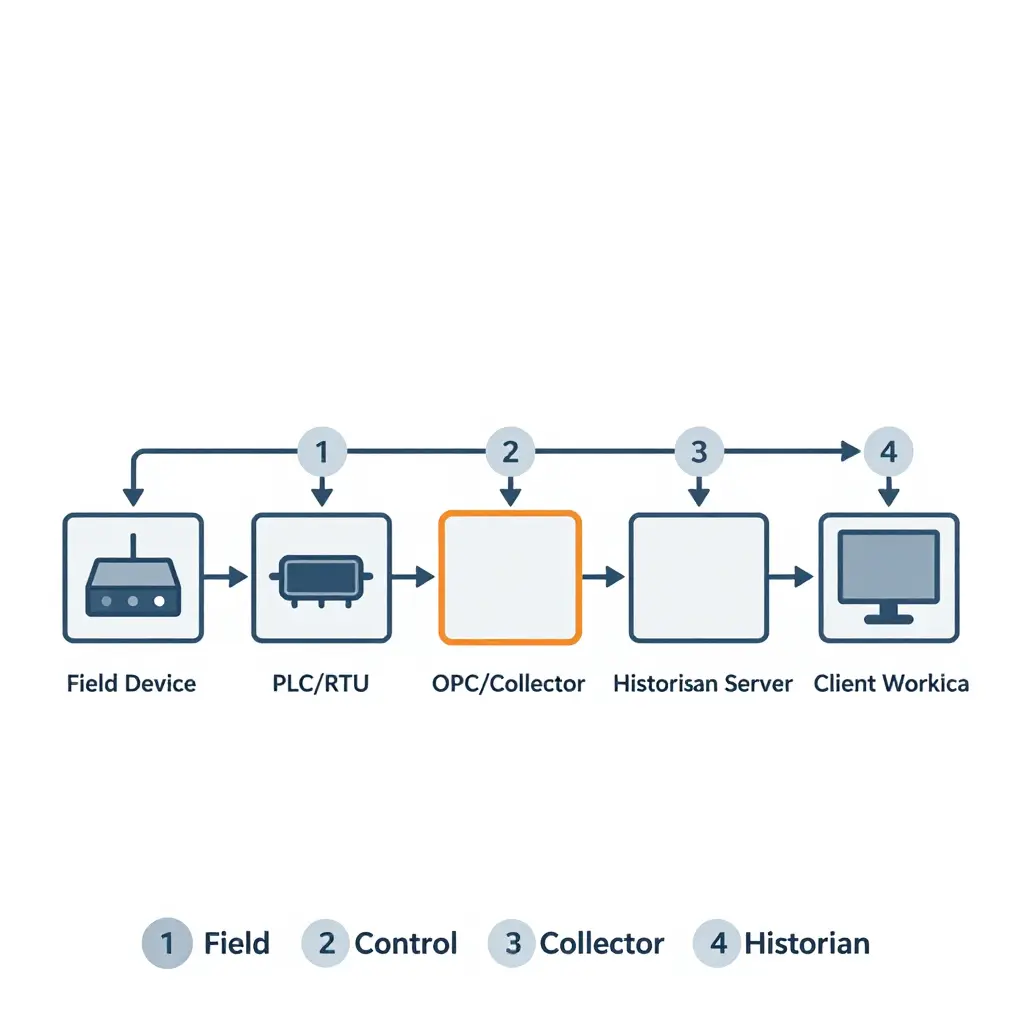
Figure 1: The SCADA data path from field device to historian, with four numbered checkpoints corresponding to the checks above.
Seven Checks Before You Blame the Network
Run these in order at the next shift change. Each step narrows the fault domain from the client down toward the collector, so you never chase the wrong layer.
- Capture the active HMI tag list from the operator station at the exact moment of handover, then export it as a fixed reference.
- Record the client’s polling interval, reconnect timeout, and any dropped-session errors sitting in the local log.
- Verify that the historian interface service (OPC DA/UA connector) is running, licensed, and pointed at the correct SCADA node.
- Compare the SCADA server’s live tag count against the historian’s subscription list; any tag present on one side but missing on the other is your prime suspect.
- Inspect the time synchronization on both hosts, because NTP drift can silently break timestamped writes.
- Confirm the collection buffer and throughput ceiling – a full queue drops tags long before the network genuinely fails.
- Document the results, screenshots included, so the next shift inherits evidence instead of rumors.
Interpreting Multiple Failures at Once
When two or more checks fail together, treat the first failure in the sequence as the root cause and the rest as downstream symptoms. A client-side capture problem will almost always cascade into a server-side comparison mismatch, so trying to “fix” four things at once only makes it harder to tell which fix worked. If time drift and buffer saturation show up together, stabilize the clock first, because timestamps govern everything that follows. In practice, genuine tag loss at shift change resolves once the earliest broken link in the chain is corrected.
Recording the Outcome for the Next Shift
Log the shift, the failing check, and the exact change you made in the maintenance journal, then annotate the historian trend with a short text marker. The handover note only needs one line: what failed, what you fixed, and what to watch.
FAQ: SCADA Historian Tag Loss at Shift Change
Is tag loss at shift change usually a network problem?
Usually no. In most plants the fault sits in the data collection layer rather than the physical network, because the timing of the gap tracks operator activity instead of link failures. When the gap clusters within a few seconds of logon or logoff events, suspect the client, the collector service, or the interface before you blame switches and cabling.
Can lost historian data be recovered or backfilled?
Sometimes, depending on where the gap actually started. If the collector buffer retained the samples, the historian can flush them once the connection returns and no data is truly lost. If the buffer overflowed or the interface dropped the values, those points are gone and must be reconstructed from shift reports, PLC logs, or manual readings.
What is the difference between stale tags and bad-quality tags?
A stale tag simply means the historian has not received a fresh value within the expected update interval, so the last good number is shown with an old timestamp. A bad-quality tag carries an explicit quality flag, such as Bad or Uncertain, that tells the system the value cannot be trusted at all. Stale data may still be accurate, while bad-quality data should never drive a control or reporting decision.
How do logoff scripts affect historian collection?
Many shift-change scripts stop services, release licenses, or close sessions, and some of those actions shut down the local collector or its OPC connection. If the script runs before the collector has finished flushing its buffer, the buffered samples are discarded silently. Reviewing exactly what each logon and logoff script does is one of the fastest ways to explain a recurring gap.
Do redundant servers prevent tag loss?
Redundancy protects against hardware failure, not against client-side or configuration faults. If both historian nodes rely on the same OPC interface or share a misconfigured collector, the gap appears on both sides at once. Redundancy only helps when the failure is truly isolated to a single node.
How often should time synchronization be verified?
Check NTP alignment at least monthly, and always after any change to network hardware or virtual infrastructure. Drift between the controllers, the OPC server, and the historian can make good samples look stale or arrive out of order. A small clock skew is often the hidden reason a shift change appears to create tag loss.
What log files should be reviewed first?
Start with the historian collector log, then move to the OPC interface and any client session logs. These three usually reveal whether the connection dropped, the buffer filled, or a quality flag was set. Event Viewer and the Windows security log help confirm whether a logoff script or a service stop coincided with the outage.
When should the network team actually be involved?
Bring them in after you have confirmed the collector, the OPC interface, and the time source are healthy. If the evidence points to packet loss, link flapping, or a saturated segment at the exact moment of shift change, that is a genuine network conversation. Calling them first usually means the real cause goes unexamined while everyone stares at switch statistics.
Conclusion: Let the Timing Pattern Guide You
Work the four checks in order: session activity during the handover, historian service and buffer health, interface and collector configuration, then scheduled jobs and clock alignment. Handled that way, SCADA historian tag loss at shift change stops being a mystery and becomes a routine checklist. None of it needs exotic tooling, just a log export, a few minutes, and a clear head.
Preventing the gap is cheaper than diagnosing it, and a handful of habits do most of the work.
Preventive Best Practices
- Document shift-change procedures. Write down who logs in, when, and what they touch. A documented handover turns an undocumented login spike into a known, expected event.
- Align scheduled maintenance away from shift boundaries. Backups, license refreshes, and service restarts that land at 06:00 or 18:00 will eventually collide with a shift handover. Move them.
- Monitor collector buffer depth and license headroom. Trend both continuously. Rising buffer depth is an early warning, and a license count that drifts toward its ceiling is a countdown.
- Validate time synchronization. Confirm NTP sources agree across PLCs, gateways, and the historian server. Skewed clocks hide tag loss or invent it.
- Review historian health after every shift change. A two-minute glance at subscription status, dropped tags, and interface logs catches recurrence before it becomes a trend.
Together these practices shrink the window in which historian tag loss can hide and turn a vague, recurring complaint into a measurable metric. None of them requires a bigger budget or a new platform. They require consistency, and consistency is cheap.
When tags do drop, check the clock before anything else. More often than not, the timing pattern, not the loudest alarm, points to the cause.
Related Resources and Further Reading
The links below cover unrelated visual customization topics and have no bearing on the SCADA historian troubleshooting guidance above.
- Browse a curated roundup of standout top dirt bike wraps for aesthetic inspiration.
- Review a full range of custom dirt bike graphics tailored to individual riders.
- Compare bundled dirt bike graphics kits suited to different bikes and budgets.
- Explore bespoke custom graphics for dirt bikes designed around personal style.
- Pick up practical top dirt bike graphics tricks for cleaner, longer-lasting finishes.
- Examine eye-catching holographic dirt bike graphics with reflective color shifts.
- Consider custom dirt bike number plate graphics for a personalized, race-ready look.
- Look through a gallery of cool dirt bike graphics ideas to spark your next project.